Are States the Biggest Enemies of Higher Education?
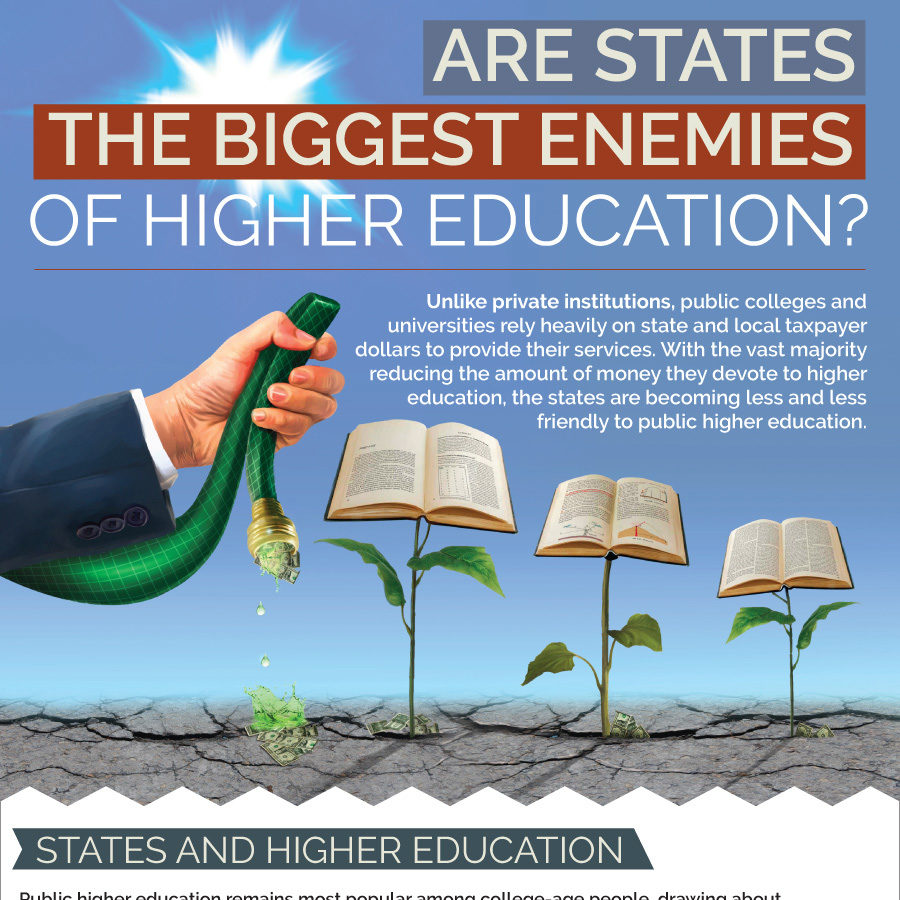
Unlike private institutions, public colleges and universities rely heavily on state and local taxpayer dollars to provide their services. With the vast majority reducing the amount of money they devote to higher education, the states are becoming less and less friendly to public higher education.
States and Higher Education
Public higher education remains most popular among college-age people, drawing about three-quarters of higher education enrollment.
Enrollment by type of institution, actual and projected (1)
Year; Public; Private
1990; 9,710,000; 2,250,000
2000; 10,539,000; 2,616,000
2011; 13,689,000; 4,374,000
2012; 13,474,000; 4,259,000
2013; 13,428,000; 4,222,000
2014; 13,666,000; 4,302,000
2015; 13,812,000; 4,343,000
2016; 14,000,000; 4,397,000
2017; 14,218,000; 4,459,000
2018; 14,394,000; 4,510,000
2019; 14,571,000; 4,563,000
2020; 14,744,000; 4,616,000
2021; 14,953,000; 4,681,000
2022; 15,169,000; 4,747,000
2023; 15,375,000; 4,810,000
Public higher education has long been the financial responsibility of the states. But recent years have seen states spending less and less on public colleges and universities.
Breakdown of funding sources (2013) (2)
State: 51%
Tuition: 43%
Local: 6%
Tax dollars still make up the majority of funding, but universities have become increasingly dependent on tuition over the past 25 years, as states and local communities have reduced their contributions to university coffers.
Tax dollars’ percentage of per-full-time-student spending by year (2)
1988: 76.2%
1989: 75.6%
1990: 75%
1991: 73.9%
1992: 71.2%
1993: 69.2%
1994: 68.8%
1995: 68.9%
1996: 68.4%
1997: 68.9%
1998: 69.4%
1999: 70%
2000: 70.8%
2001: 70.7%
2002: 69.9%
2003: 67.7%
2004: 65.1%
2005: 64%
2006: 63.6%
2007: 63.8%
2008: 64.5%
2009: 62.6%
2010: 59.6%
2011: 57.6%
2012: 53.4%
2013: 52.9%
Making Cuts
Every state but Alaska and North Dakota is spending less on higher education than before the Great Recession.
Change in per-student spending, 2008-14 (3)
Louisiana: -$5,004
Hawaii: -$4,648
New Mexico: -$4,588
Alabama: -$4,413
Idaho: -$3,857
South Carolina: -$3,761
Massachusetts: -$3,704
Nevada: -$3,430
Connecticut: -$3,293
Arizona: -$3,082
North Carolina: -$2,999
Florida: -$2,745
Georgia: -$2,656
Kentucky: -$2,649
Mississippi: -$2,524
Washington: -$2,498
Oregon: -$2,386
Tennessee: -$2,310
New Jersey: -$2,263
Utah: -$2,230
Pennsylvania: -$2,206
Minnesota: -$2,160
Arkansas: -$2,073
Iowa: -$2,031
Oklahoma: -$2,005
Texas: -$1,923
Delaware: -$1,996
Missouri: -$1,914
West Virginia: -$1,859
Virginia: -$1,852
Kansas: -$1,663
New Hampshire: -$1,659
Rhode Island: -$1,649
Michigan: -$1,631
Ohio: -$1,481
Colorado: -$1,407
Wisconsin: -$1,401
South Dakota: -$1,388
California: -$1,373
New York: -$1,154
Maine: -$1,136
Nebraska: -$1,099
Maryland: -$1,015
Illinois: -$851
Vermont: -$717
Indiana: -$547
Montana: -$422
Wyoming: -$93
Alaska: +$636
North Dakota: +$3,150
23%
Average decrease in states’ per-student investment (4)
Three states — Arizona, Louisiana and South Carolina — have cut their funding by more than 40%. (4)
What Are the Effects?
The single biggest effect, as we’ve seen, of states trimming their higher education budgets is that the institutions will rely more heavily on tuition dollars. That means college is getting more expensive. While that isn’t the only effect, it may be the most obvious.
Rising tuition
27%
Average increase in four-year tuition at public colleges from 2007-12 (4)
Program and staff cuts
Arizona’s state university system cut more than 2,100 positions, eliminated more than 150 programs or departments and closed 8 local campuses. (4)
Such cuts run the risk of degrading the quality and experience of public education.
Sources:
1. http://www.sheeo.org/sites/default/files/publications/SHEF_FY13_04172014.pdf
2. https://nces.ed.gov/programs/digest/d13/tables/dt13_105.20.asp
4. http://www.cbpp.org/blog/mapping-state-funding-cuts-for-higher-education

